
Market analysis10 min read
Which state loves Pokémon most? Hawaii tops our 50-state index
We ranked all 50 states and D.C. per person on Google searches, Play! Pokémon tournaments, stores, and card shows. Hawaii is #1, Wisconsin stays in the top 3 under every method we tried, and California, the state with the most events, venues, and stores, lands in the bottom half.

Market analysis
Hawaii #1most Pokémon-popular state per person in our index
On this page
Nobody publishes Pokémon sales by state, so “most popular” has to be built from what people actually do. We pulled four kinds of public data for every state and D.C., divided each by population, and combined them into one index: how much a state searches for Pokémon, how much it plays in official tournaments, how many stores it supports, and how many card shows it runs.
Hawaii comes out on top. It leads every Google search measure we pulled, has one of the busiest card-show calendars per person, and is in a near tie with Wisconsin and Oregon for the most League Cups and Challenges per person. Wisconsin is second and the steadiest result in the data. California has more events, stores, and shops than any other state, but per person it ranks 35th.
The top two are solid, not exact. In 5,000 simulations that add random noise to every count and search score, Hawaii finished first 82% of the time and Wisconsin 15%.
Key takeaways
- #1 Hawaii. Highest Google interest in the US for Pokémon, the Pokémon TCG, Pokémon GO, and “pokemon cards” (index 100 on all four, past 12 months), and #1 on both measures we re-checked over five years. First in 82% of 5,000 noise simulations.
- #2 Wisconsin. #1 on the organized-play pillar, with among the most Pre Releases (2.48 per 100,000) and League Cups and Challenges (4.64, 1.8× the national rate) per person. The only state in the top 3 under all 17 ways we built the ranking.
- Then New Hampshire and Oregon, a coin flip for third. New Hampshire is a store-and-show state with middling search; Oregon is strong on search, play, and stores but thin on listed card shows.
- Big isn’t the same as popular. California has more events (1,356), tournament venues (295), and stores than any other state and ranks #3 on search, but #35 overall per person. Texas is #36, Florida #42, New York #46.
- The Midwest and West lead; the South trails. Average index score: Midwest 59.9, West 58.0, Northeast 48.3, South 37.8.
The 5 most Pokémon-popular of the 50 states + D.C., per person
Index score (0–100), split by what each pillar adds
Each bar is the overall score; colors show how much each pillar adds (each is worth up to 25 points). Hawaii’s lead comes from search and card shows; Wisconsin’s from play and stores. Scores are relative ranks, not precise measurements; see how sturdy the ranking is below. Full ranking of all 51 at the end.
 Poké Life · poke-life.comData as of Oct 19, 2026
How we measured it#
Every measure is a per-person rate, so a big state can’t win on size alone. Each one is scored as a percentile among the 50 states and D.C. (0 = lowest, 100 = highest), and the four pillars count equally.
| Pillar | What goes in | Source |
|---|---|---|
| Search | Google Trends interest, past 12 months, for the Pokémon, Pokémon TCG, and Pokémon GO topics and the search “pokemon cards” | Google Trends (already a share of each state’s searches) |
| Organized play | League Cups and Challenges (trading card game, video game, and Pokémon GO) per 100,000 residents; TCG Pre Releases per 100,000 | 13,234 official Play! Pokémon events, Sep 1, 2026 to Nov 30, 2026 |
| Stores | Venues hosting Play! Pokémon events; card shops; hobby, toy, and game stores (each per million) | Play! Pokémon locator; CardsNearby directory; Census County Business Patterns 2023 |
| Card shows | Distinct show series per million, from two directories | MyShowPin (Pokémon shows); Cutter’s Collection (Pokémon and trading card shows) |
Population is the Census Bureau’s July 1, 2025 estimate. The pieces cover different stretches of time: search is the past 12 months, events Sep 1, 2026 to Nov 30, 2026, Census stores 2023, and card shows the listings on file now. Card shows are counted once per series, so a weekly trade night doesn’t outweigh a yearly convention. Major championships (Regionals, Internationals, Worlds) are listed below for context but not scored, because The Pokémon Company picks host cities for convention space, not fan density.
Pokémon popularity by state, per person
Toggle the overall index or one of its four pillars. Darker = higher score, in five equal steps from the lowest state to the highest. Hover or tap a state for its ranks.
Hawaii ranks #1 overall with a score of 85.5
Hawaii leads search (100.0)
Wisconsin leads organized play (99.0)
Alaska leads stores (92.0)
Hawaii leads card shows (98.0)
- Overall
- Search
- Play
- Stores
- Shows
Overall index and each pillar. Data as of Oct 19, 2026; events cover Sep 1, 2026 to Nov 30, 2026.
Poké Life · poke-life.comData as of Oct 19, 2026; ranks of 50 states + D.C.
Hawaii: the searching, show-going state#
Hawaii scored 100 on all four Google Trends measures, meaning Pokémon takes a bigger share of searches there than anywhere else in the US. It also led both measures we re-checked over five years (the Pokémon and Pokémon TCG topics), so this isn’t a one-year spike.
It isn’t a quirk of Google’s data either. Hawaii ranks #51 for “video games” and #39 for Nintendo. But it also tops the One Piece Card Game and ranks #3 for anime and #3 for the Yu-Gi-Oh! card game, so its Pokémon interest fits a broader pull toward Japanese franchises. Google counts searches where they happen, so visitors’ searches are in there too.
On the ground, Hawaii runs 4.75 League Cups and Challenges per 100,000 people, against a national 2.61. That’s essentially tied with Wisconsin (4.64) and Oregon (4.61); the gaps are smaller than the random swing in counts this size. Its card-show calendar is busy too: 4.2 Pokémon show series per million on MyShowPin, about 4.6× the national rate, though that rests on just 6 shows, and most of Hawaii’s listed shows mix sports cards with trading card games.
Its weak spot is stores: #28 of 51, with 18 tournament venues for 1,432,820 people. That’s why Hawaii’s lead depends on how you weigh things. Drop search from the index and it falls to #4; drop card shows and it falls to #5; count card shows at 10% instead of 25% and Oregon edges it out.
Wisconsin: the steadiest result#
Wisconsin is #1 for organized play, with 277 League Cups and Challenges and 148 Pre Releases across 88 venues, near the top on both per person. It is #7 on stores and #9 on card shows, and only #11 on search. No single pillar carries it, which is why it stays in the top 3 however the index is built. Milwaukee hosted a Regional Championship last season and hosts another in April 2027.
The rest of the top 10#
| Rank | State | Score | Search | Play | Stores | Shows |
|---|---|---|---|---|---|---|
| 1 | Hawaii | 85.5 | #1 | #2 | #28 | #1 |
| 2 | Wisconsin | 82.6 | #11 | #1 | #7 | #9 |
| 3 | New Hampshire | 78.6 | #23 | #9 | #2 | #5 |
| 4 | Oregon | 75.3 | #6 | #3 | #3 | #44 |
| 5 | West Virginia | 71.7 | #17 | #11 | #21 | #6 |
| 6 | Delaware | 70.7 | #35 | #10 | #8 | #4 |
| 7 | Iowa | 70.7 | #30 | #7 | #18 | #7 |
| 8 | Utah | 69.8 | #4 | #6 | #4 | #47 |
| 9 | Washington | 69.7 | #2 | #8 | #16 | #39 |
| 10 | Indiana | 69.4 | #8 | #5 | #25 | #19 |
Pillar columns are each state’s rank of 51. Pillar leaders: search Hawaii, organized play Wisconsin, stores Alaska, card shows Hawaii.
Big states: the most Pokémon, spread thin#
By raw counts, the biggest states dominate. California (1,356), Texas (1,225), Florida (808), New York (628), and Pennsylvania (542) had the most Play! Pokémon events in the window. Divide by population and they slide: California runs 2.33 League Cups and Challenges per 100,000 people against a national 2.61, and 7.5 venues per million against 8.4.
Above or below the national rate, per person
Green states beat the US rate; red states trail it. Hover or tap a state for its numbers.
US rate: 2.61 League Cups and Challenges per 100k
US rate: 8.4 venues hosting Play! Pokémon events per million
US rate: 25.8 hobby, toy, and game stores (Census) per million
·
·
·
- Under 0.75×
- 0.75–0.9×
- 0.9–1.1×
- 1.1–1.5×
- 1.5× or more
Each state’s rate as a multiple of the US rate. California runs 0.9× the national tournament rate; Wisconsin, 1.8×. Census store counts are from 2023 and include toy and hobby stores, not just card shops.
Poké Life · poke-life.comData as of Oct 19, 2026; US = 50 states + D.C.
California is the clearest case of a state that searches far more than it plays: #3 on search, #35 on play, #44 on stores. New York is low on both (#42 search, #37 play).
Searchers vs. players#
Comparing each state’s search score with its average on the three in-person pillars splits the map:
- Search more than they play (10): Nevada, Minnesota, Alaska, Oklahoma, Kansas, Illinois, Arizona, California, Texas, and Florida.
- Play more than they search (14): New Hampshire, Delaware, Iowa, Rhode Island, North Dakota, Nebraska, Wyoming, Maine, Vermont, Tennessee, Connecticut, South Dakota, Louisiana, and Mississippi.
The second group is mostly smaller states, where a handful of active stores and shows go a long way per person.
By region#
| Census region | States | Average score | Highest-ranked |
|---|---|---|---|
| Midwest | 12 | 59.9 | Wisconsin (#2) |
| West | 13 | 58.0 | Hawaii (#1) |
| Northeast | 9 | 48.3 | New Hampshire (#3) |
| South | 17 | 37.8 | West Virginia (#5) |
Georgia ranks #50 even though Atlanta hosts a Regional Championship this season, a reminder that a big event says more about convention space than about local fans. Major championship hosts in the 2026 and 2027 seasons: Wisconsin (#2), Washington (#9), Indiana (#10), Nevada (#12), Kentucky (#21), Pennsylvania (#26), Illinois (#33), California (#35), Texas (#36), Florida (#42), Louisiana (#43), Maryland (#45), and Georgia (#50).
How sturdy is the ranking?#
We built the index 17 ways: our main method plus 16 alternatives, including different scoring math, dropping each pillar in turn, weighting card shows less, counting show listings instead of series, leaving out Census stores, a second Google Trends pull, and three different event windows. Hawaii was #1 in 14 of them. Wisconsin was in the top 3 in all 17, and Hawaii, New Hampshire, Oregon, and Wisconsin were in the top 10 every time. The three that put Hawaii lower drop search or shrink or drop card shows, so the headline does depend on counting shows as a quarter of the index. We kept them there because shows are a separate, in-person kind of activity from tournaments and stores.
Then we tested noise. In 5,000 simulations that redraw every count at random around its observed value and nudge every search score, Hawaii finished first 82% of the time, Wisconsin 15%. Third place is a coin flip between New Hampshire and Oregon. From fifth place to about 20th, ranks overlap heavily: a state’s likely range spans 7 to 17 places (for example, West Virginia 4–16). Measuring per resident aged 5–34 instead of all residents puts Hawaii #1; counting only card shows with Pokémon or TCG in the name puts it #1.
All 26 data checks passed. Event, Census, and directory totals matched each source’s published figure (we couldn’t collect a few percent of Cutter’s Collection listings in nine large states), no event’s listed state contradicted its street address, and an independent recalculation reproduced every score.
What this can’t tell you#
- No sales. State-level Pokémon sales, grading, and collector counts aren’t published. This index measures attention and activity, not money.
- Short event window, filling in. The official locator lists events from the start of the season (Sept. 1) and about six weeks ahead, and part of the window is heavy with Pre Releases for the next set. Later weeks are under-listed until stores add events, which favors stores that schedule early. Using only events already held (Sept. 1 to Oct. 18), Hawaii is still #1. Events are as listed; we can’t see cancellations or attendance.
- Store counts favor small, spread-out states. Where people live far apart, each store serves fewer of them, so per-person store counts partly measure geography. The stores pillar runs opposite to population (rank correlation −0.55), and Alaska leads it on 8 venues and 22 shops. Census counts also miss owner-run shops with no employees.
- Activity crosses state lines. Rates are per resident of the state where the activity happens. New Hampshire and Delaware have no sales tax and sit next to big metros; D.C. is a city whose players and stores largely sit in the Maryland and Virginia suburbs, which likely explains much of its last-place rank.
- Show directories are promoter-submitted and only partly agree with each other. Cutter’s Collection also includes sports-card shows. Card shows are the index’s weakest pillar.
- Small states move more. A few stores or shows change a small state’s rate a lot.
- Search ≠ fans. Google Trends is a share of searches made in a state, by residents and visitors, not a count of people.
- The profiles are our cutoffs. “Searches more than it plays” means a 20-point gap between the search pillar and the in-person average; states near the line could fall either way.
Suggested citation: Poké Life, “Which state loves Pokémon most?”, data as of Oct 19, 2026, https://www.poke-life.com/research/pokemon-popularity-by-state/. For tournament volume and density alone, see Where Pokémon TCG is biggest in the US.
Full ranking#
| Rank | State | Score | Search | Play | Stores | Shows | Profile |
|---|---|---|---|---|---|---|---|
| 1 | Hawaii | 85.5 | #1 | #2 | #28 | #1 | All-around |
| 2 | Wisconsin | 82.6 | #11 | #1 | #7 | #9 | All-around |
| 3 | New Hampshire | 78.6 | #23 | #9 | #2 | #5 | Plays more than it searches |
| 4 | Oregon | 75.3 | #6 | #3 | #3 | #44 | All-around |
| 5 | West Virginia | 71.7 | #17 | #11 | #21 | #6 | All-around |
| 6 | Delaware | 70.7 | #35 | #10 | #8 | #4 | Plays more than it searches |
| 7 | Iowa | 70.7 | #30 | #7 | #18 | #7 | Plays more than it searches |
| 8 | Utah | 69.8 | #4 | #6 | #4 | #47 | All-around |
| 9 | Washington | 69.7 | #2 | #8 | #16 | #39 | All-around |
| 10 | Indiana | 69.4 | #8 | #5 | #25 | #19 | All-around |
| 11 | Idaho | 69.2 | #14 | #12 | #10 | #15 | All-around |
| 12 | Nevada | 66.5 | #5 | #15 | #13 | #36 | Searches more than it plays |
| 13 | Rhode Island | 64.5 | #31 | #16 | #26 | #2 | Plays more than it searches |
| 14 | Missouri | 64.3 | #24 | #13 | #17 | #13 | Balanced |
| 15 | Ohio | 62.6 | #22 | #18 | #23 | #10 | Balanced |
| 16 | North Dakota | 61.8 | #29 | #4 | #5 | #41 | Plays more than it searches |
| 17 | Nebraska | 59.5 | #36 | #19 | #9 | #16 | Plays more than it searches |
| 18 | Minnesota | 59.4 | #9 | #14 | #22 | #34 | Searches more than it plays |
| 19 | Wyoming | 59.1 | #33 | #30 | #6 | #14 | Plays more than it searches |
| 20 | Michigan | 55.9 | #18 | #17 | #30 | #25 | Balanced |
| 21 | Kentucky | 55.0 | #16 | #32 | #35 | #8 | Balanced |
| 22 | Alaska | 53.4 | #10 | #31 | #1 | #50 | Searches more than it plays |
| 23 | New Mexico | 51.5 | #32 | #23 | #15 | #37 | Balanced |
| 24 | Virginia | 51.0 | #20 | #27 | #37 | #18 | Balanced |
| 25 | Maine | 50.3 | #41 | #44 | #20 | #3 | Plays more than it searches |
| 26 | Pennsylvania | 49.0 | #26 | #20 | #27 | #35 | Balanced |
| 27 | Colorado | 48.7 | #21 | #22 | #14 | #48 | Balanced |
| 28 | Oklahoma | 47.9 | #13 | #42 | #32 | #21 | Searches more than it plays |
| 29 | Kansas | 47.8 | #12 | #43 | #31 | #20 | Searches more than it plays |
| 30 | Vermont | 47.8 | #45 | #26 | #12 | #24 | Plays more than it searches |
| 31 | Tennessee | 47.6 | #39 | #21 | #29 | #22 | Plays more than it searches |
| 32 | Connecticut | 46.6 | #38 | #38 | #24 | #11 | Plays more than it searches |
| 33 | Illinois | 46.4 | #15 | #25 | #43 | #29 | Searches more than it plays |
| 34 | Arizona | 45.2 | #7 | #39 | #33 | #40 | Searches more than it plays |
| 35 | California | 41.3 | #3 | #35 | #44 | #45 | Searches more than it plays |
| 36 | Texas | 40.7 | #19 | #28 | #42 | #38 | Searches more than it plays |
| 37 | South Dakota | 38.9 | #46 | #24 | #11 | #46 | Plays more than it searches |
| 38 | North Carolina | 38.2 | #28 | #34 | #38 | #30 | Balanced |
| 39 | Massachusetts | 37.4 | #34 | #40 | #34 | #27 | Balanced |
| 40 | South Carolina | 37.0 | #43 | #33 | #36 | #23 | Balanced |
| 41 | New Jersey | 33.9 | #27 | #47 | #48 | #17 | Balanced |
| 42 | Florida | 33.4 | #25 | #36 | #40 | #42 | Searches more than it plays |
| 43 | Louisiana | 30.3 | #47 | #29 | #39 | #32 | Plays more than it searches |
| 44 | Arkansas | 29.8 | #40 | #41 | #41 | #31 | Balanced |
| 45 | Maryland | 29.4 | #37 | #45 | #46 | #26 | Balanced |
| 46 | New York | 26.9 | #42 | #37 | #49 | #33 | Balanced |
| 47 | Mississippi | 22.7 | #51 | #49 | #47 | #12 | Plays more than it searches |
| 48 | Alabama | 19.2 | #48 | #48 | #45 | #28 | Balanced |
| 49 | Montana | 18.7 | #49 | #50 | #19 | #51 | Balanced |
| 50 | Georgia | 15.1 | #44 | #46 | #50 | #43 | Balanced |
| 51 | District of Columbia | 2.0 | #50 | #51 | #51 | #49 | Balanced |
Share this chart
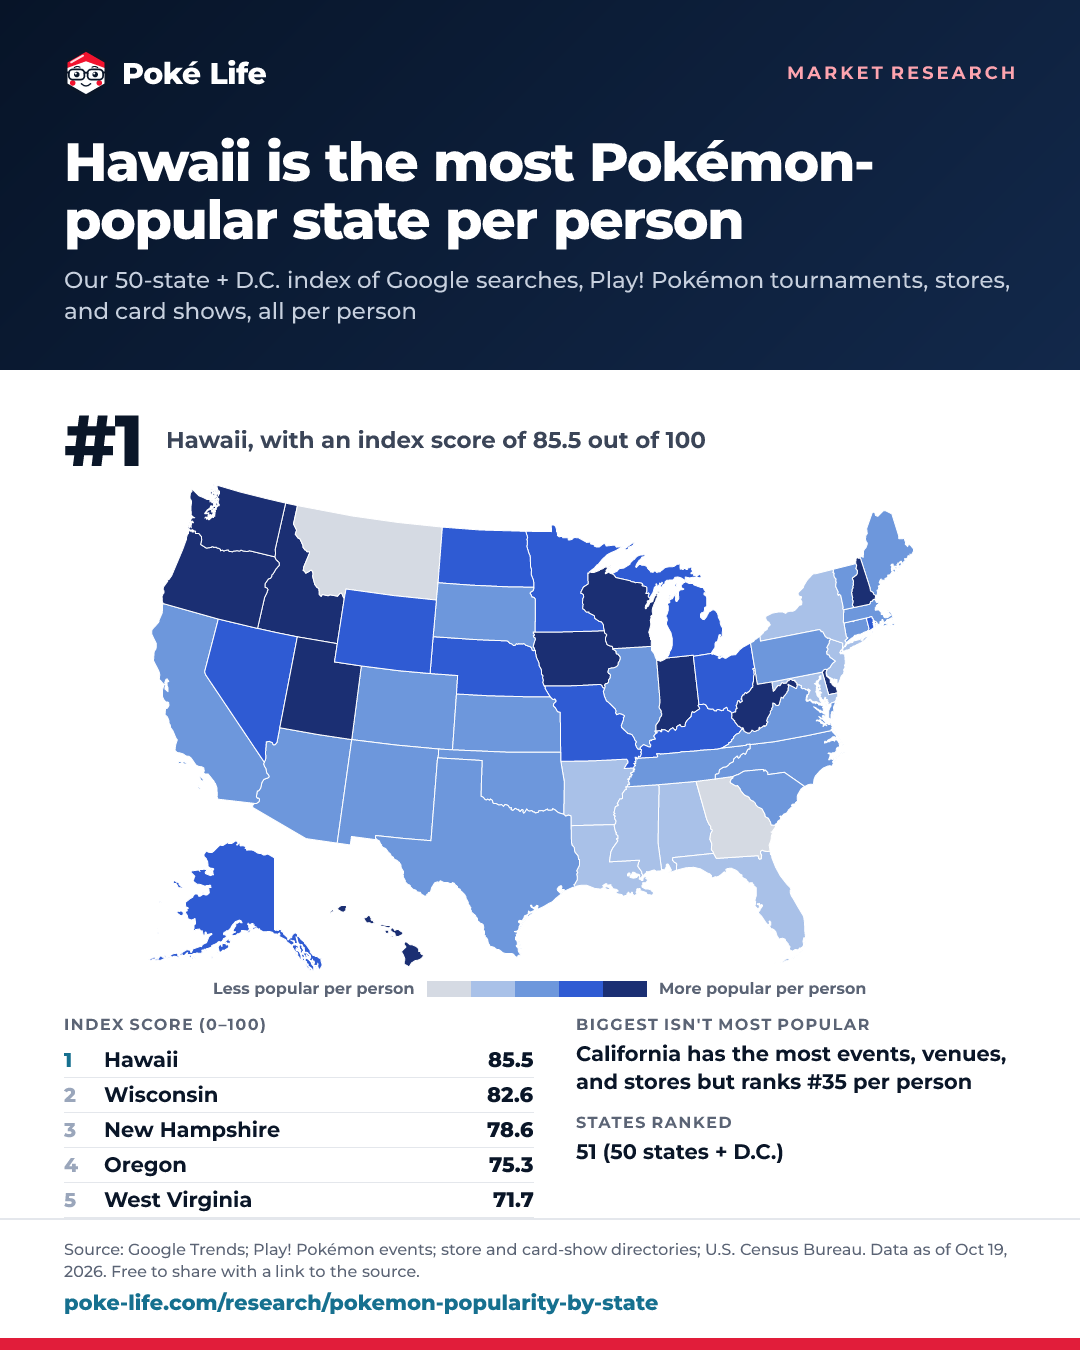
This infographic is free to use in articles, newsletters, videos, and posts under CC BY 4.0: credit Poké Life with a link to this page. It's redrawn from the same data whenever our numbers update.
Download PNG (1080×1350)